require(mosaic)
Let's start by generating some random data. Note: R is very good at this!
# create a vector of the integers from 1 to 100
x = 1:100
# generate a standard normal random variable
p = rnorm(1)
# raise x to the p^th power, and add some randomness
y = jitter(x^p, factor = length(x)/2)
# Combine x and y into a data frame
Rand = data.frame(x, y)
Now, let's pretend that we don't know the value of \( p \). That is, we know that \( y \) is a function of \( x \) raised to some power, but we don't know what that power is. Our interest, since this class is about building linear regression models, is to transform the \( y \) variable so that we can figure out a linear regression model that works well. To do this, we are going to employ graphical techniques in an attempt to linearize the relationship between our data (which most likely is related in a non-linear fashion).
plotPoints(y ~ x, data = Rand)
fm = lm(y ~ x, data = Rand)
summary(fm)
plot(fm, which = 1)
plot(fm, which = 2)
At this point you have two variables (\( x \) and \( y \)) which are clearly related, but most likely not in an obvious linear pattern. We are going to manually apply transformations to the \( y \) variable in an attempt to straighten out the relationship between \( x \) and \( y \). A helpful heuristic for applying transformations is given by Tukey's Bulging Rule and Ladder of Powers.
The ladder gives us a set of transformations that correspond to an exponent, to which we are going to raise \( y \). Here is the ladder:
| Rung (exponent \( q \)) | Step (transformation \( f_q(y) \)) |
|---|---|
| 3 | \( y^3 \) |
| 2 | \( y^2 \) |
| 1 | \( y \) |
| \( \frac{1}{2} \) | \( \sqrt{y} \) |
| 0 | \( \log{(y)} \) |
| -1 | \( -\frac{1}{y} \) |
| -2 | \( -\frac{1}{y^2} \) |
| -3 | \( -\frac{1}{y^3} \) |
Note that in general, we can think of moving up or down the ladder as raising \( y \) to the power corresponding to the rung in the ladder \( q \). However, this is not literally true (for example, \( y^0 \neq \log{(y)} \)!). The actual rule that will generate the ladder is:
\[
f_q(y) = \begin{cases}
y^q & \text{if } q > 0 \\
\log{y} & \text{if } q = 0 \\
-y^{q} & \text{if } q < 0
\end{cases}, \qquad \text{where }q\text{ is the rung of the ladder}
\]
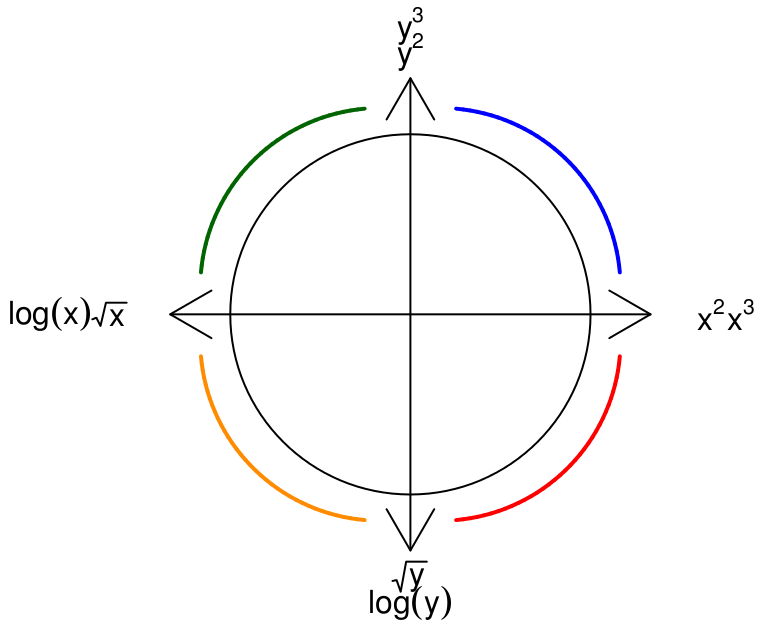
The following diagram gives us insight as to how which transformations are likely to work. For example, suppose the pattern we see in the data is shaped similar to the blue line in the first quadrant of the diagram below. Then since both \( x \) and \( y \) are positive in that quadrant, we should try moving up the ladder in either \( y \), \( x \), or both. Many people find it easiest to think about transformations of the \( y \) variable, so let's try that first.
# e.g. for a log transformation
Rand$y.new = with(data = Rand, log(y))
Note that you may have to try multiple transformations until you find something that works well.
plotPoints(y.new ~ x, data = Rand)
Recall that we are assuming that \( y \) is a function of \( x^p \), for some unknown value of \( p \). If you have successfully straightened out your data, then you've applied the transformation corresponding to the \( q^{th} \) rung of Tukey's ladder. Thus, your plot is actually showing \( f_q(y) \) as a function of \( x \). Since this plot is linear, it appears that \( f_q(y) \sim x \). Suppose for a moment that \( q \) is positive, so that \( f_q(y) = y^q \). Then our model implies that
\[
f_q(y) \sim x \Rightarrow y^q \sim x
\]
But we are assuming that \( y \sim x^p \). Thus,
\[
y^q \sim x \Rightarrow (x^p)^q = x \Rightarrow pq = 1 \Rightarrow p = 1/q
\]
This implies that if we were able to linearize our data using the trasnformation corresponding to the \( q^{th} \) rung of Tukey's ladder, then \( p \) should be roughly equal to the reciprocal of \( q \).
The previous method for applying transformations was labor-intensive, since we had to repeatedly compute the transformations and then re-plot them. We can take advantage of the manipulate functionality in RStudio to do this automatically.
p = rnorm(1)
Rand$y = jitter(x^p, factor = length(x)/2)
tukeyLadder = function(x, q = NULL) {
    if (is.null(q)) {
        return(x)
    }
    if (q == 0) {
        x.new = log(x)
    } else {
        if (q < 0) {
            x.new = -x^q
        } else {
            x.new = x^q
        }
    }
    return(x.new)
}

tukeyPlot = function(x, y, q.y, q.x = 1, ...) {
    y.new = tukeyLadder(y, q.y)
    x.new = tukeyLadder(x, q.x)
    y.center = mean(y.new, na.rm = TRUE)
    x.center = mean(x.new, na.rm = TRUE)
    x.bottom = 0.1 * (max(y.new) - min(y.new)) + min(y.new)
    y.left = 0.1 * (max(x.new) - min(x.new)) + min(x.new)
    xyplot(y.new ~ x.new, panel = function(x, y, ...) {
        panel.xyplot(x, y, pch = 19, alpha = 0.2, cex = 2)
        panel.text(y.left, y.center, paste("q.y =", q.y), col = "red", cex = 2)
        panel.text(x.center, x.bottom, paste("q.x =", q.x), col = "red", cex = 2)
    })
}

require(manipulate)
manipulate(with(Rand, tukeyPlot(x, y, q.y)), q.y = slider(-3, 3, step = 0.25,
    initial = 1))
In the previous exercise, we fabricated data using the relationship \( y = x^p \). Next, let's look at some real data, where the relationship between \( y \) and \( x \) is truly unknown.
SpA = read.csv("http://www.math.smith.edu/~bbaumer/mth247/SpeciesArea.csv")
plotPoints(Species ~ Area, data = SpA)

manipulate(with(SpA, tukeyPlot(Area, Species, q.y, q.x)), q.y = slider(-3, 3,
    step = 0.25, initial = 1), q.x = slider(-3, 3, step = 0.25, initial = 1))
plotPoints(log(Species) ~ log(Area), data = SpA)